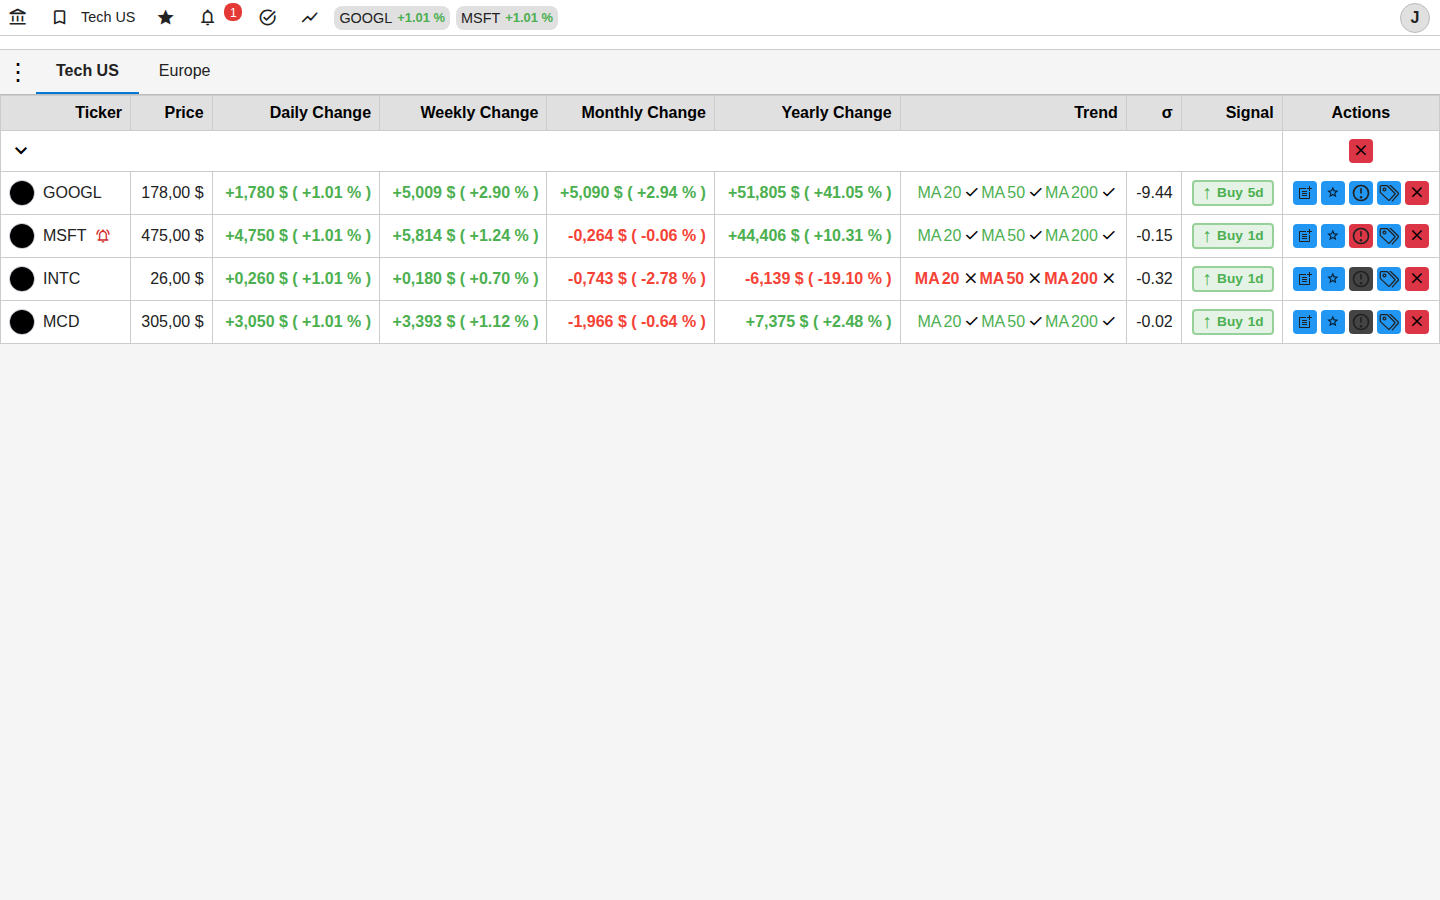
Chart Analysis, Manual or Automatic
Dive into an interactive chart with powerful indicators and drawing tools, or scan all your assets at once with the automatic technical radar.
Time Navigation
Explore an asset's full history, from minute to several years, with total responsiveness.
Detect major cycles and understand historical market psychology at each price level.
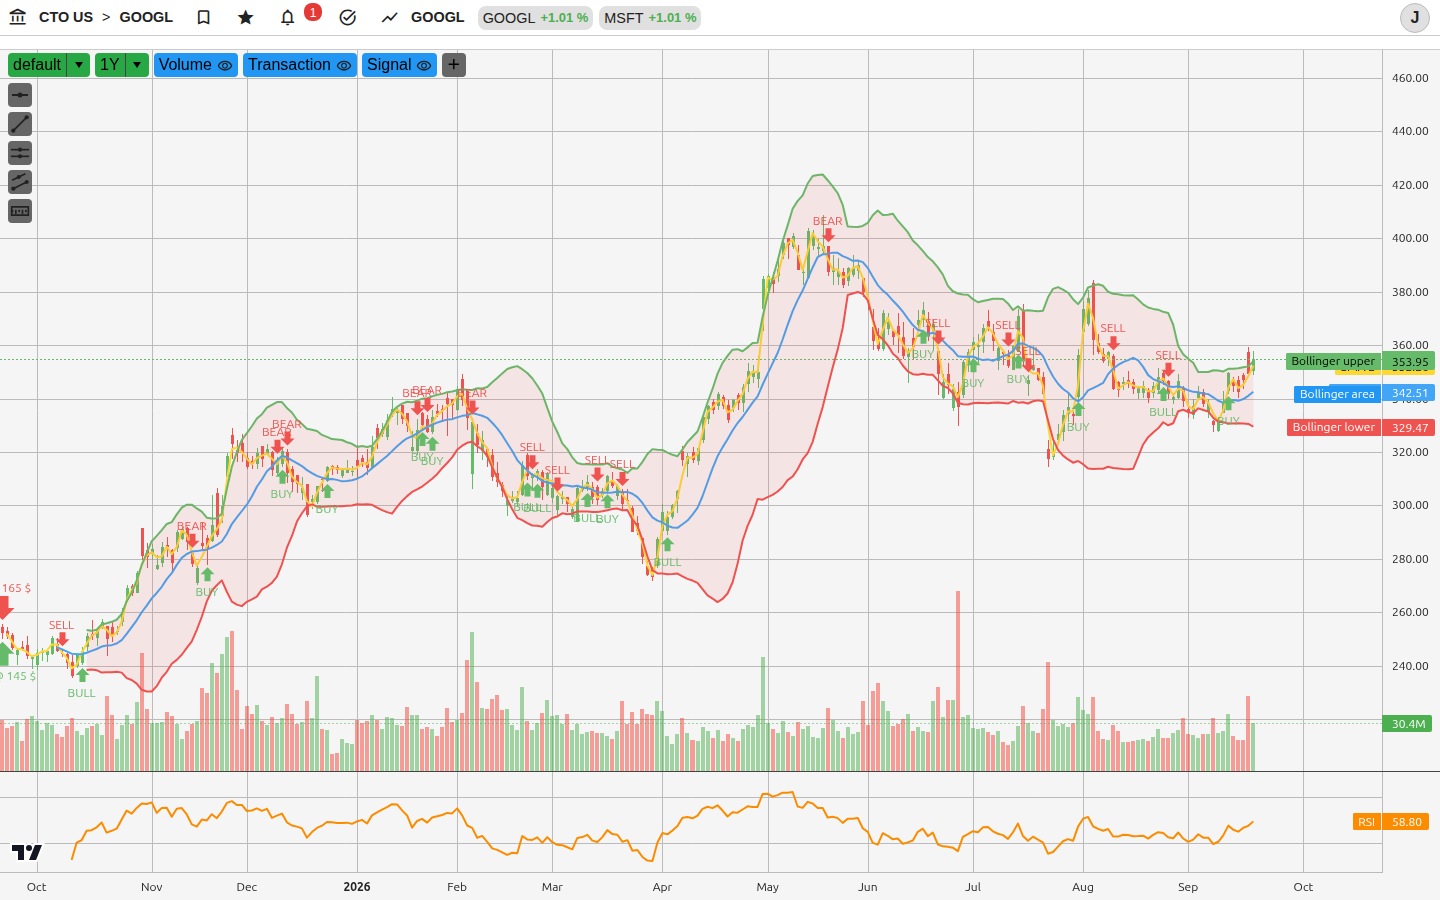
Indicator Visualization
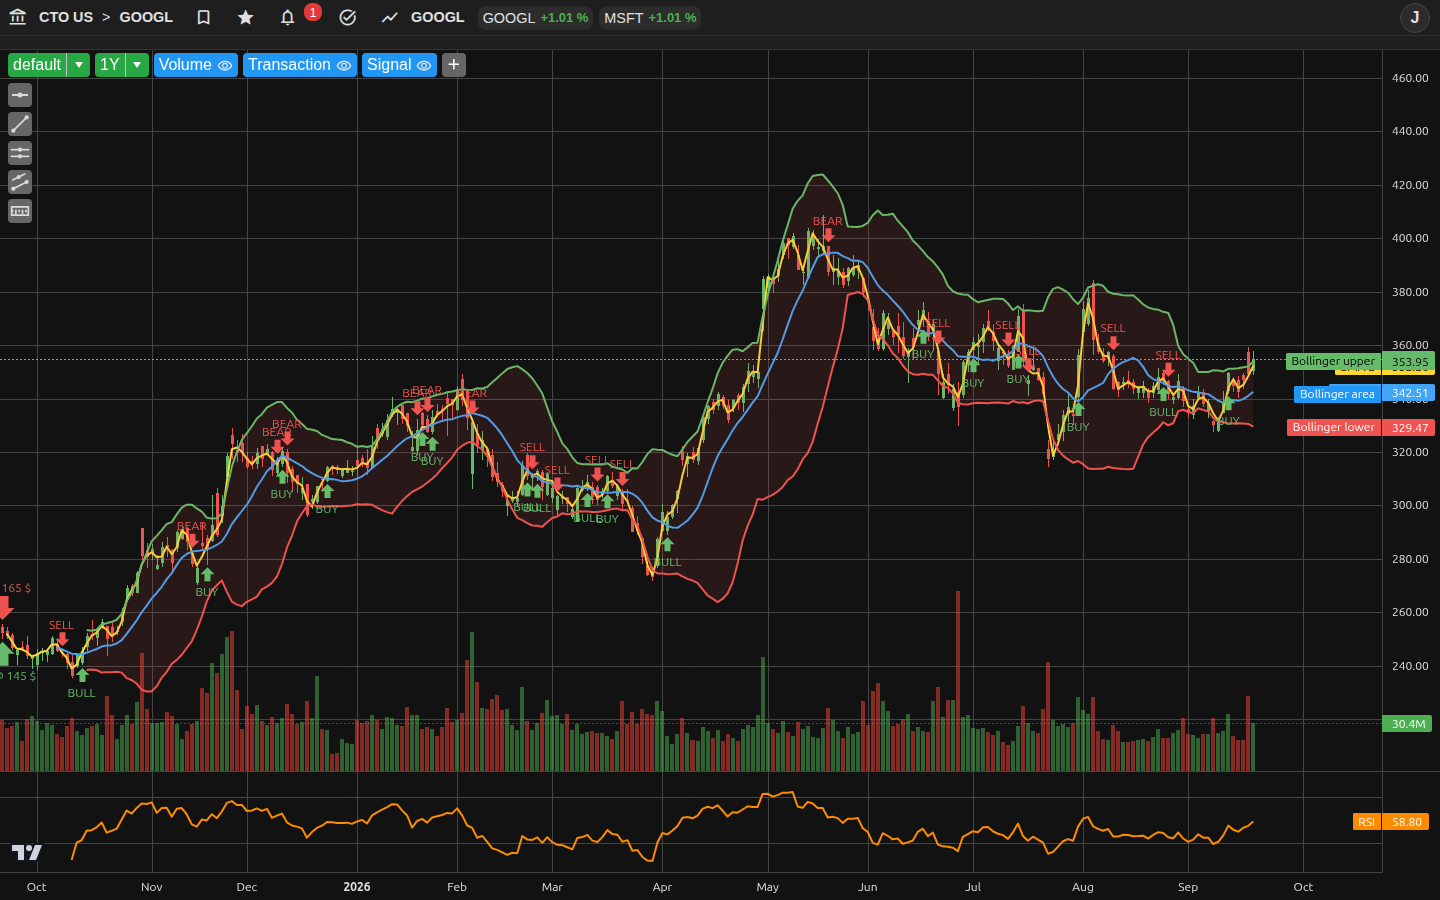
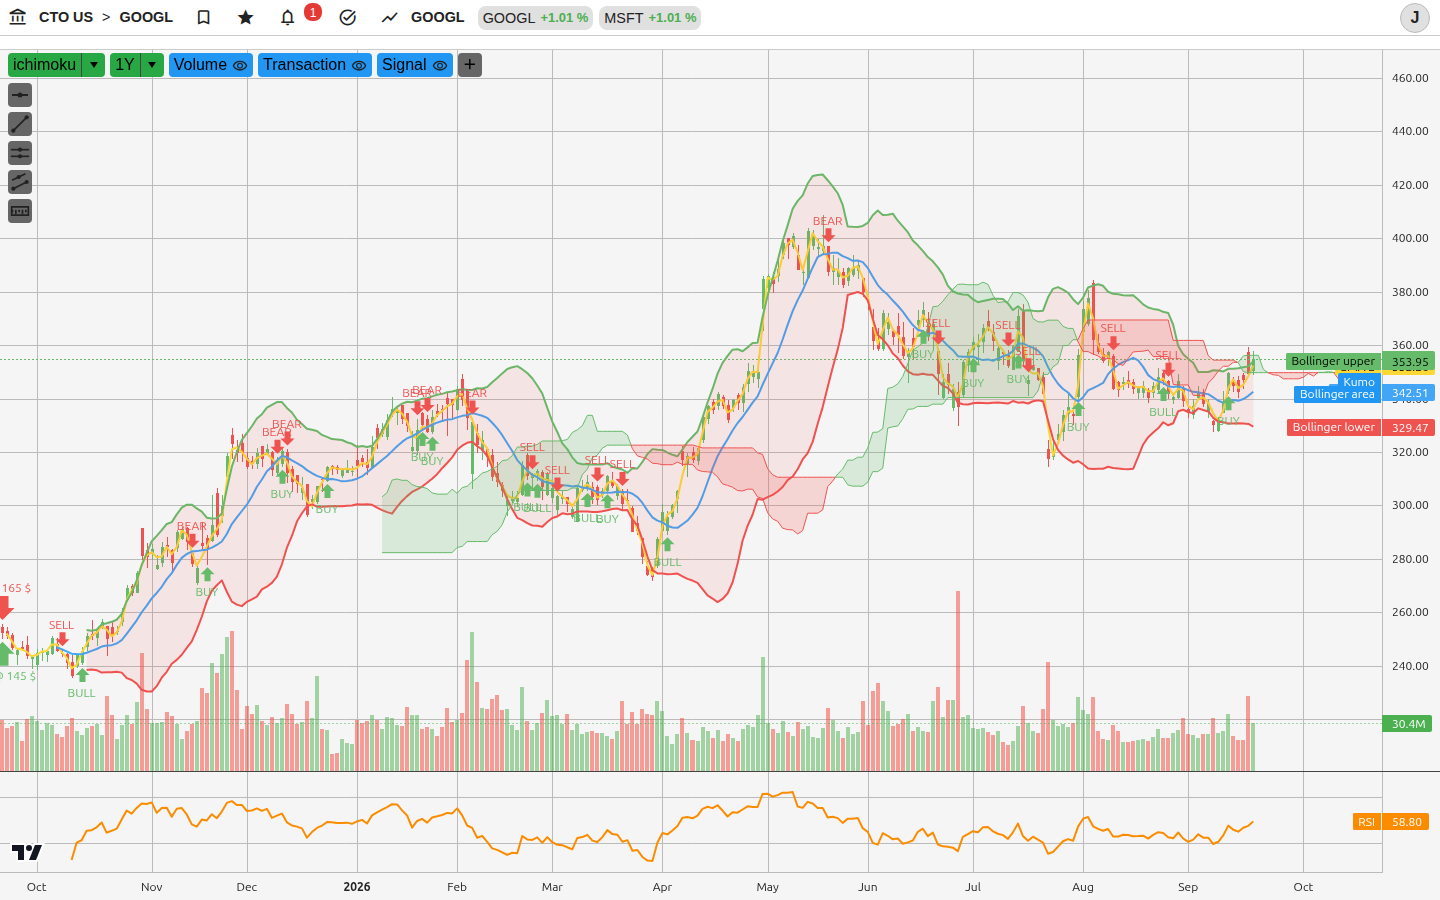
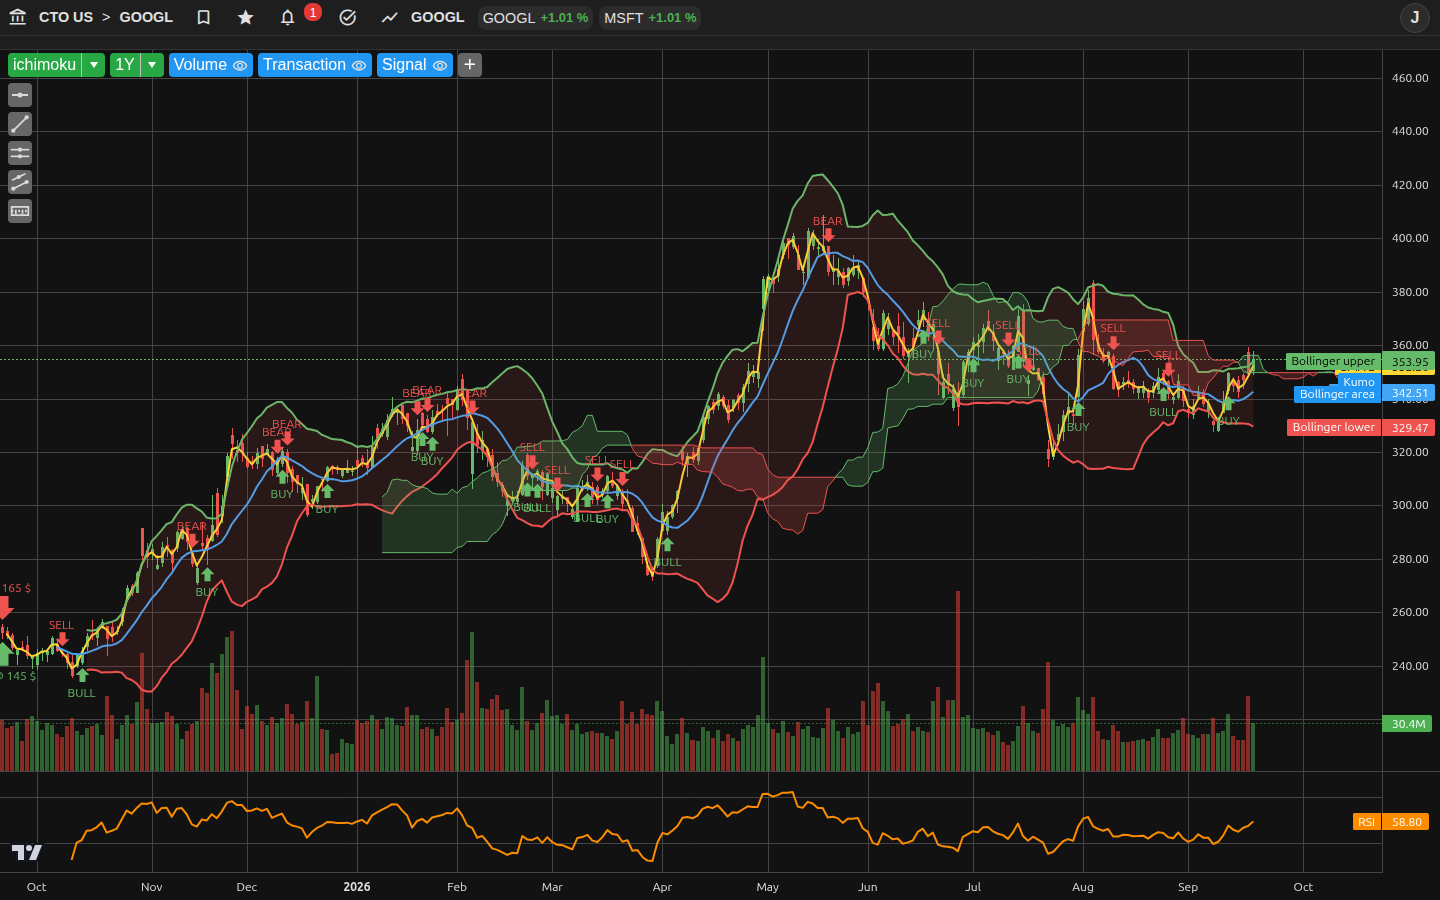
Overlay your favorite technical indicators (Moving Averages, RSI, Bollinger Bands, Linear Regression, Ichimoku) to confirm entry and exit signals.
Adapt your vision to isolate the underlying trend or micro-volatility movements.
Precision Drawing Tools
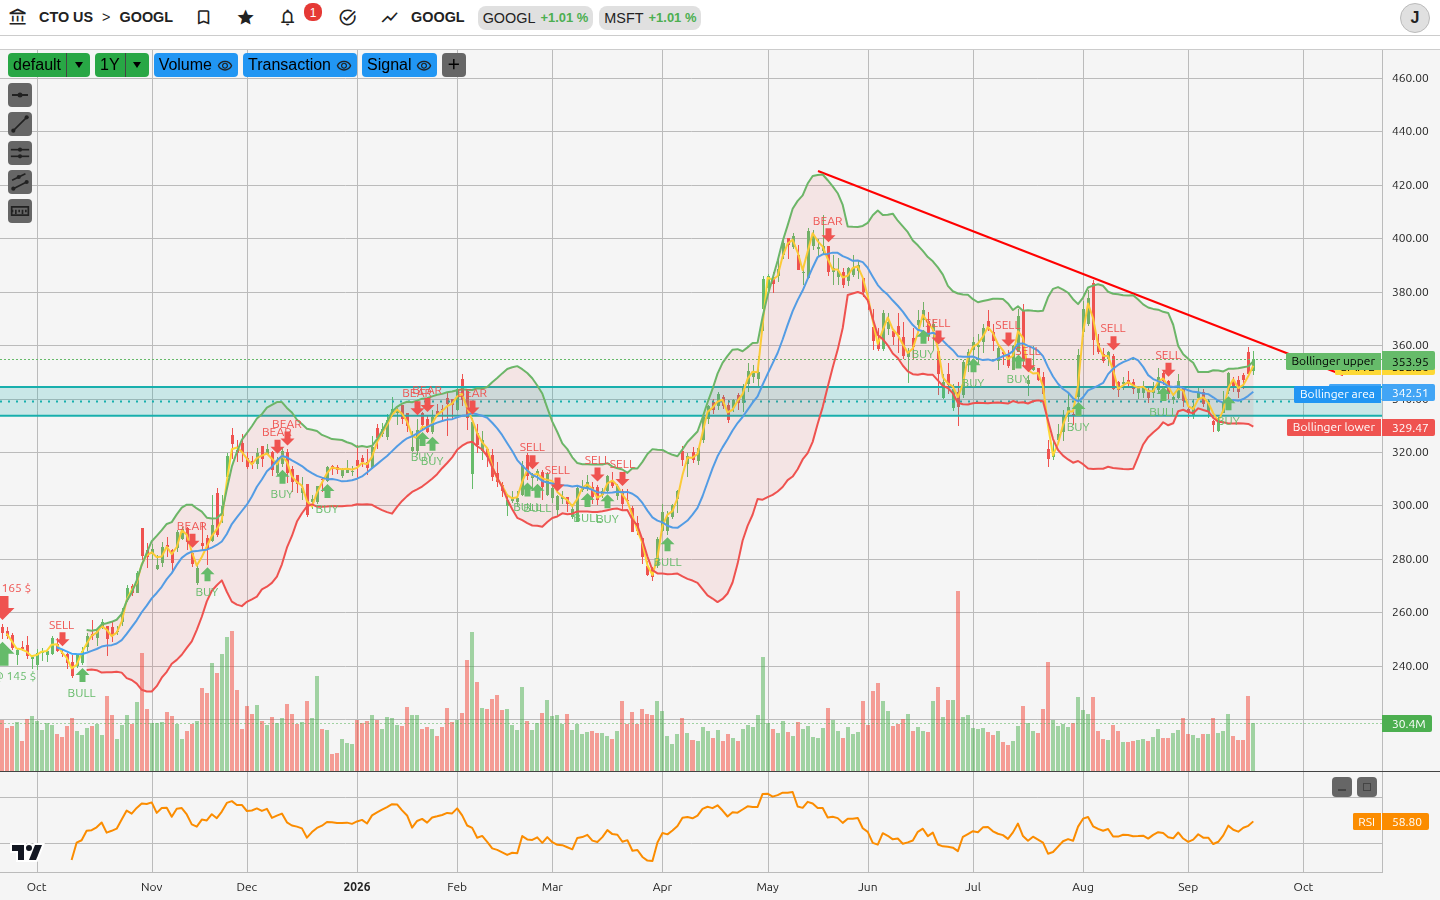
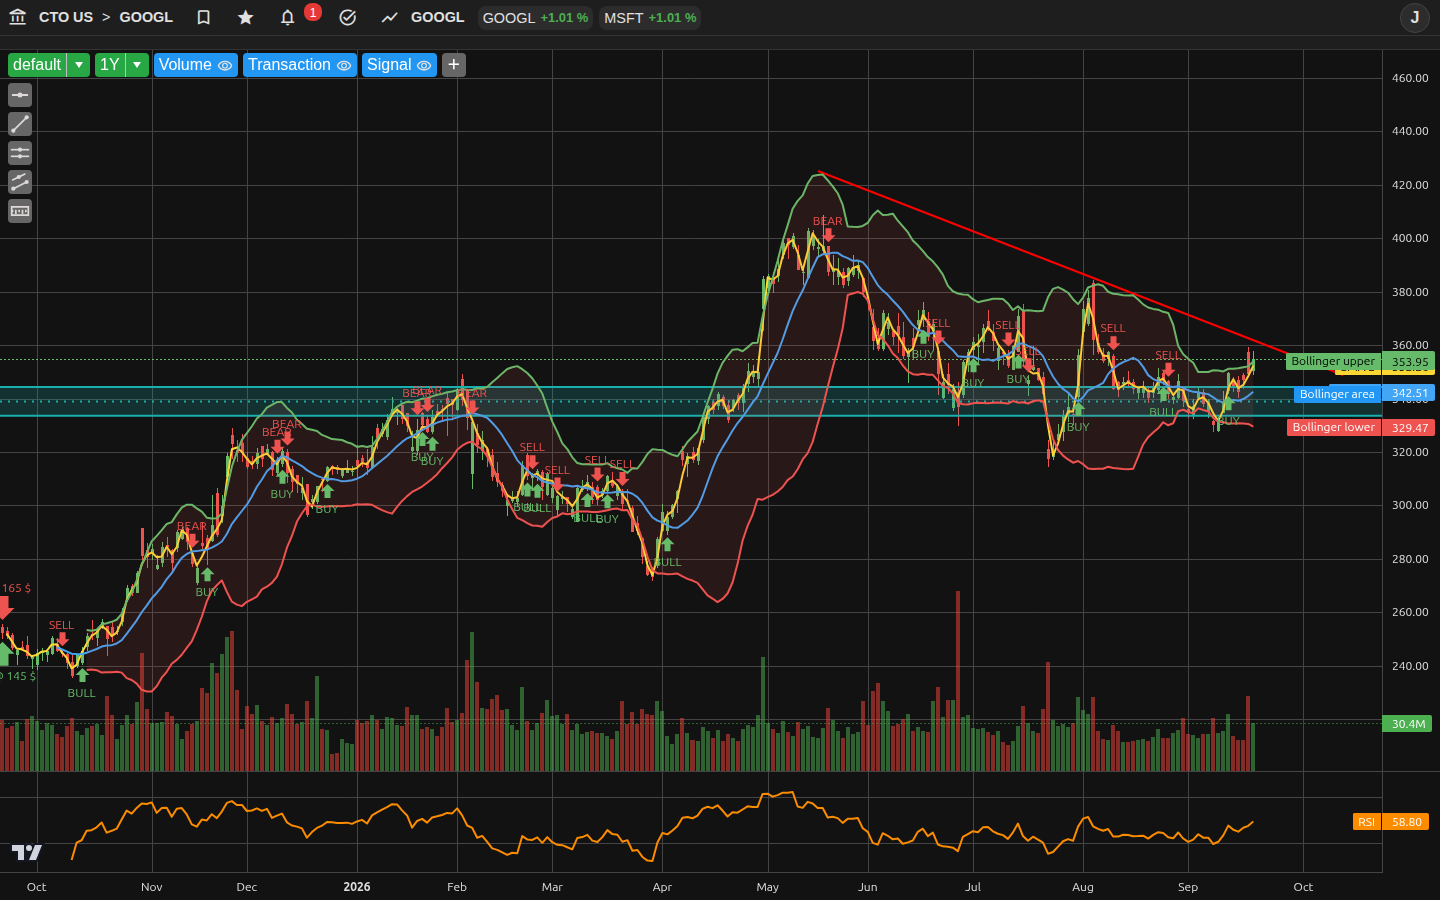
Draw trend lines, channels, and supports directly on the price with automatic saving.
Materialize your psychological thresholds and rigorously define your exit targets.
Unified Dashboard
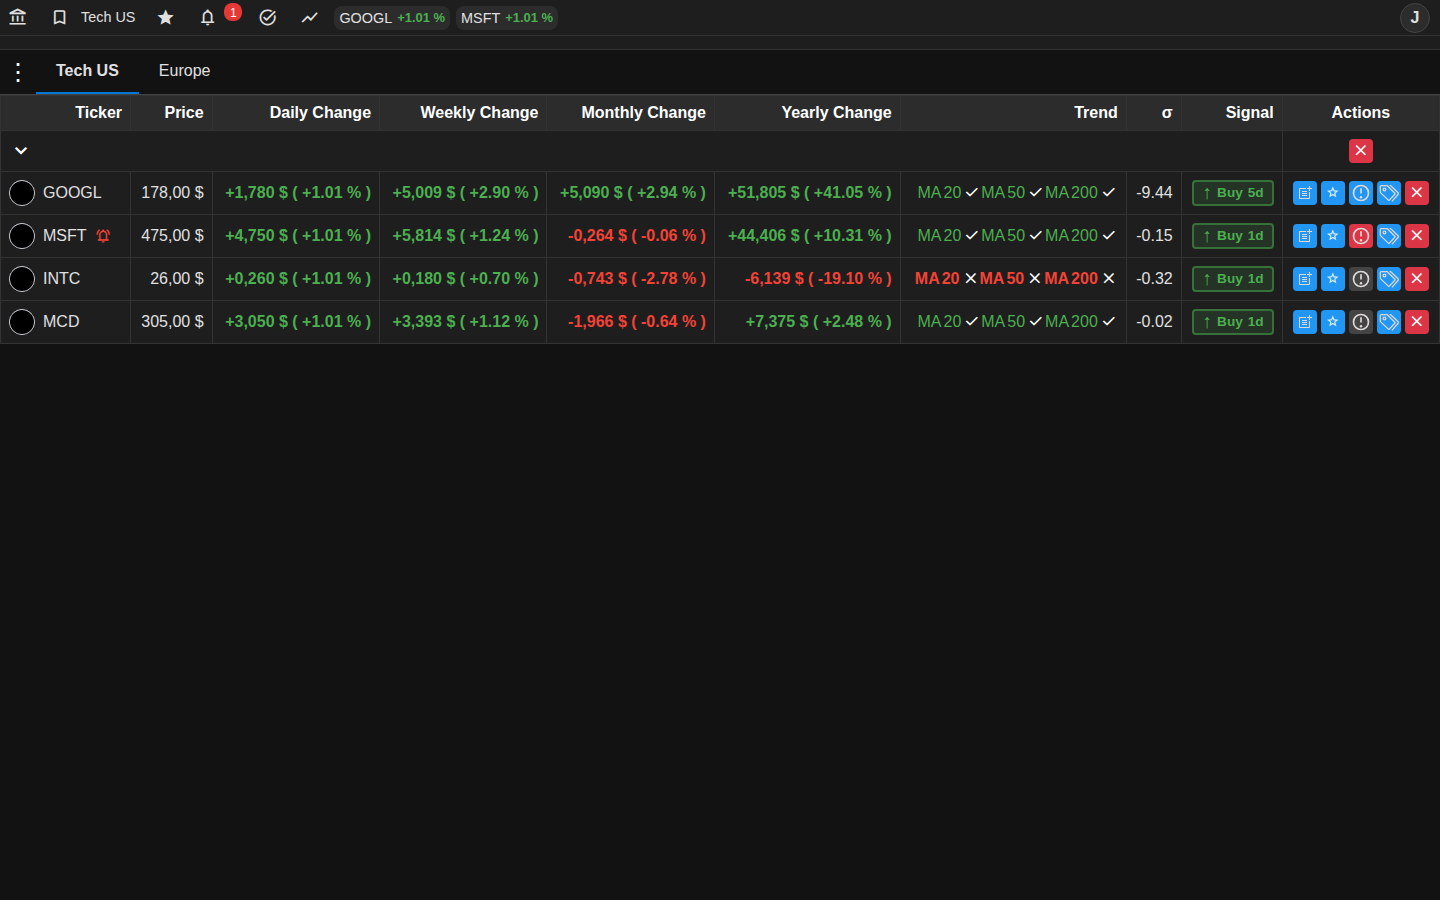
A consolidated view including variations (D/W/M/Y), trends (MA20/50/200), linear regression deviation (Sigma), and algorithmic signals.
Instantly identify the best opportunities in your portfolio and watchlists without research effort.