Your Portfolio, Fully in View
Track every transaction and understand your real profitability, then bring all your accounts together in a single 360° dashboard.
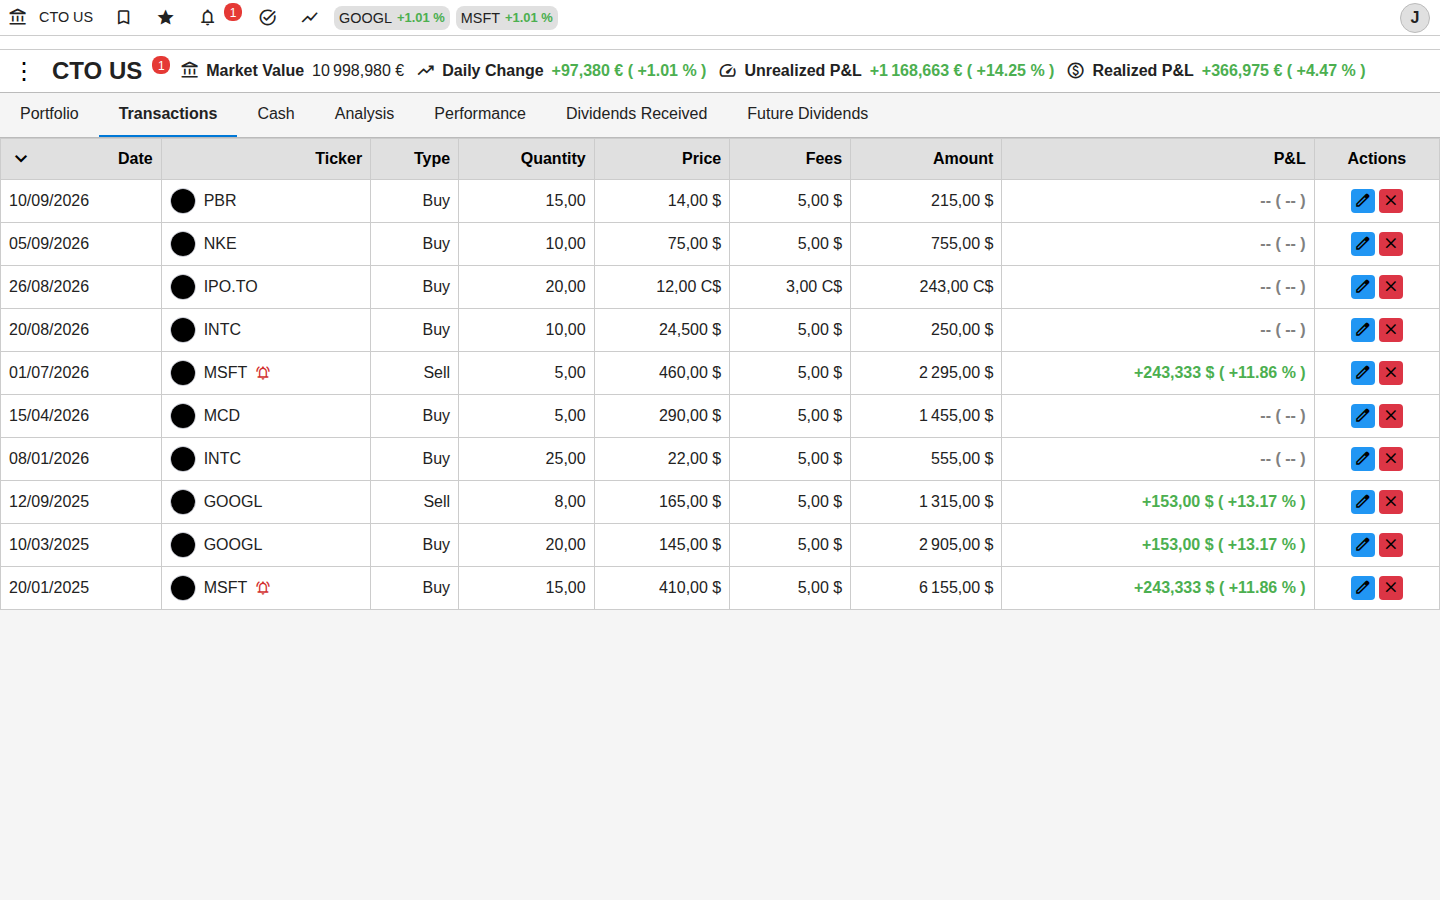
Master Your History
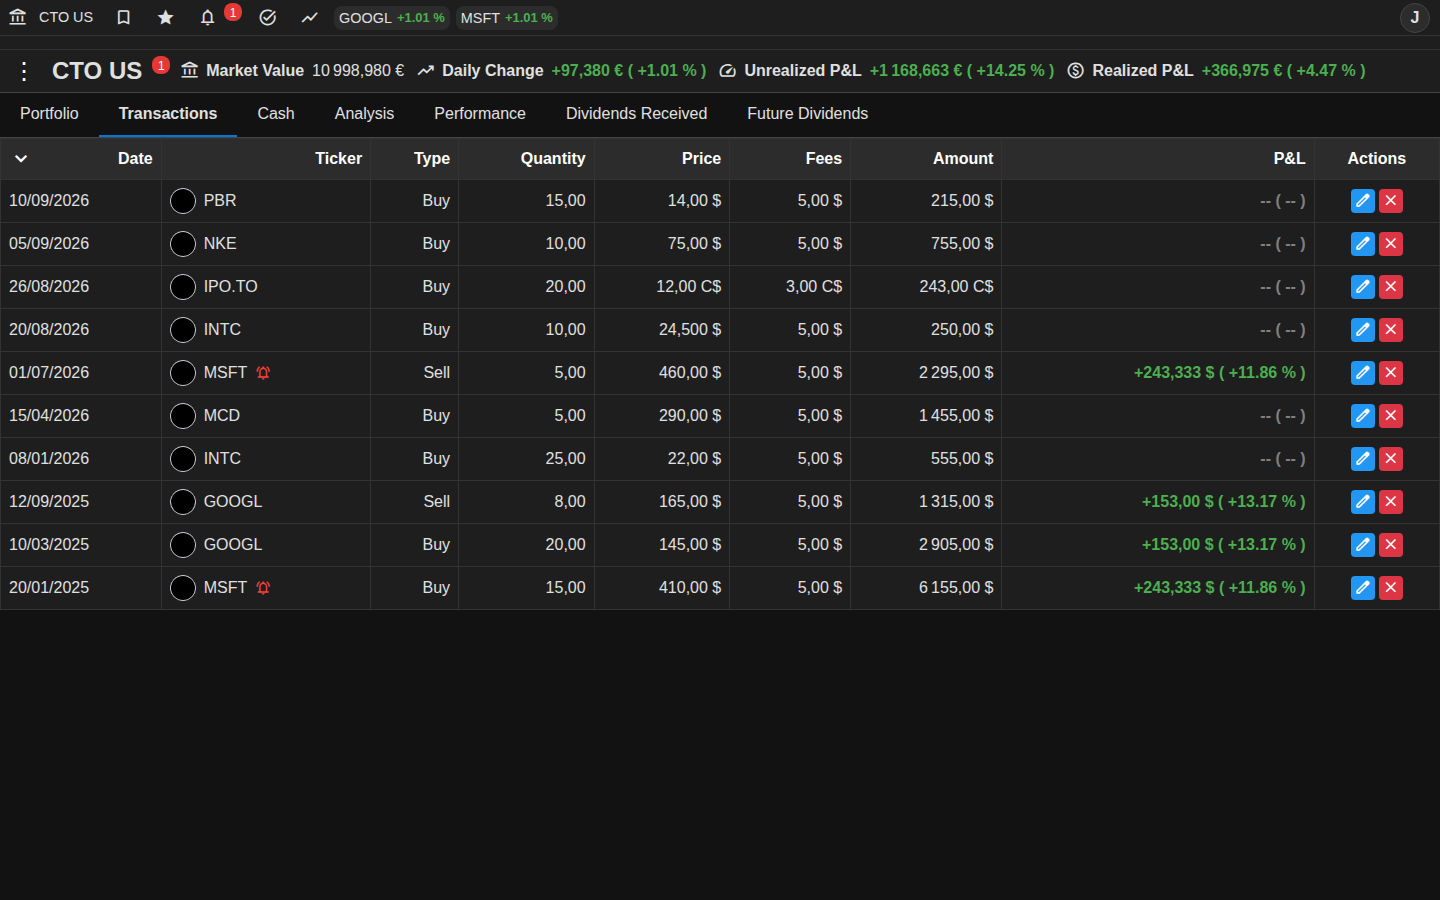
Centralize all your buys and sells to precisely calculate your cost basis and real capital gains.
A clear view of past decisions to better prepare your future orders.
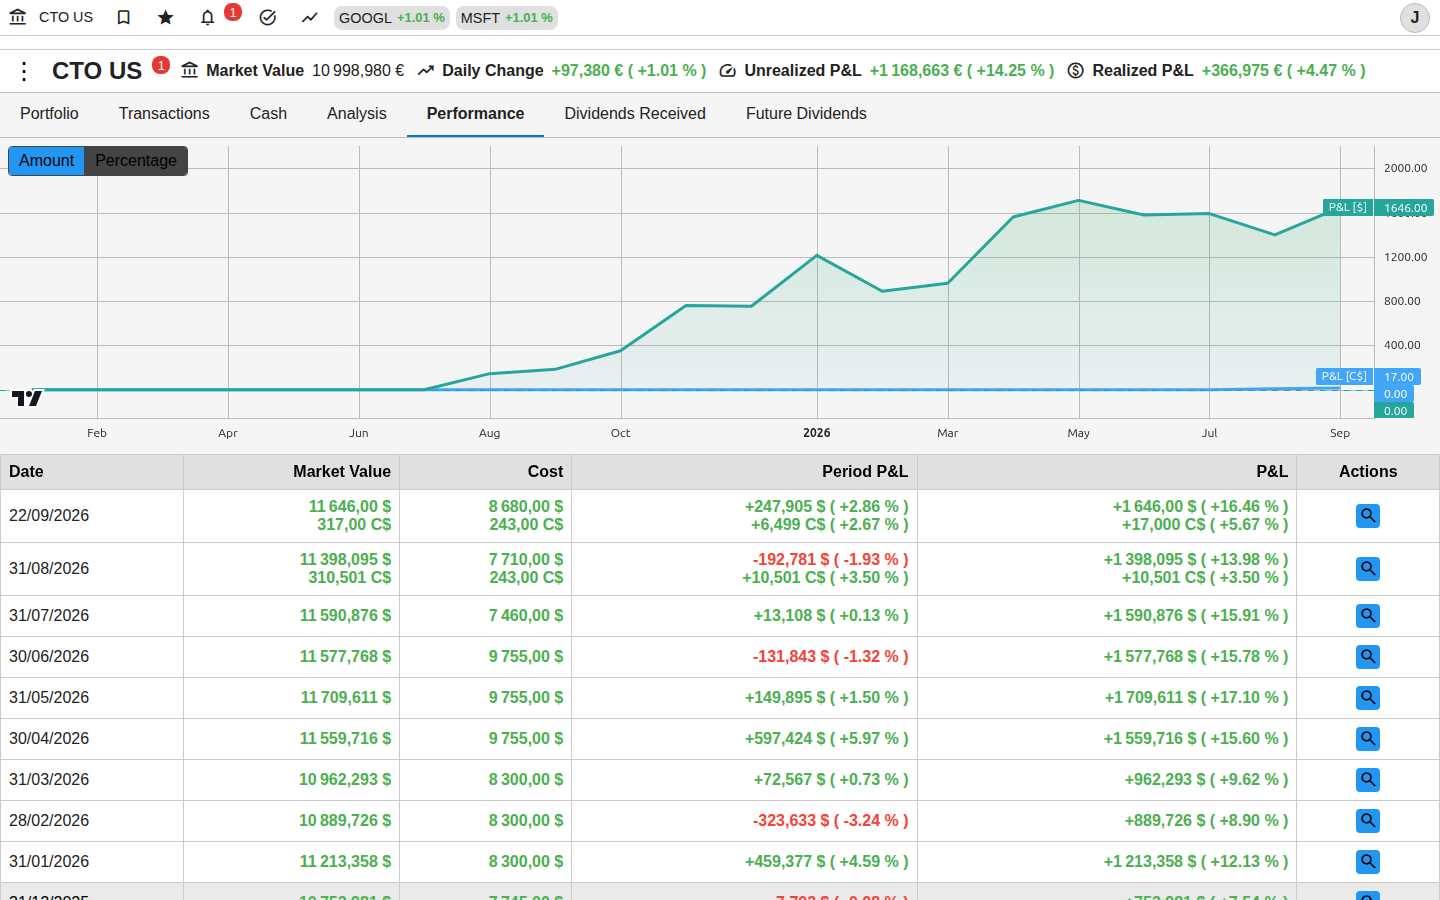
Real-Time Performance Analysis
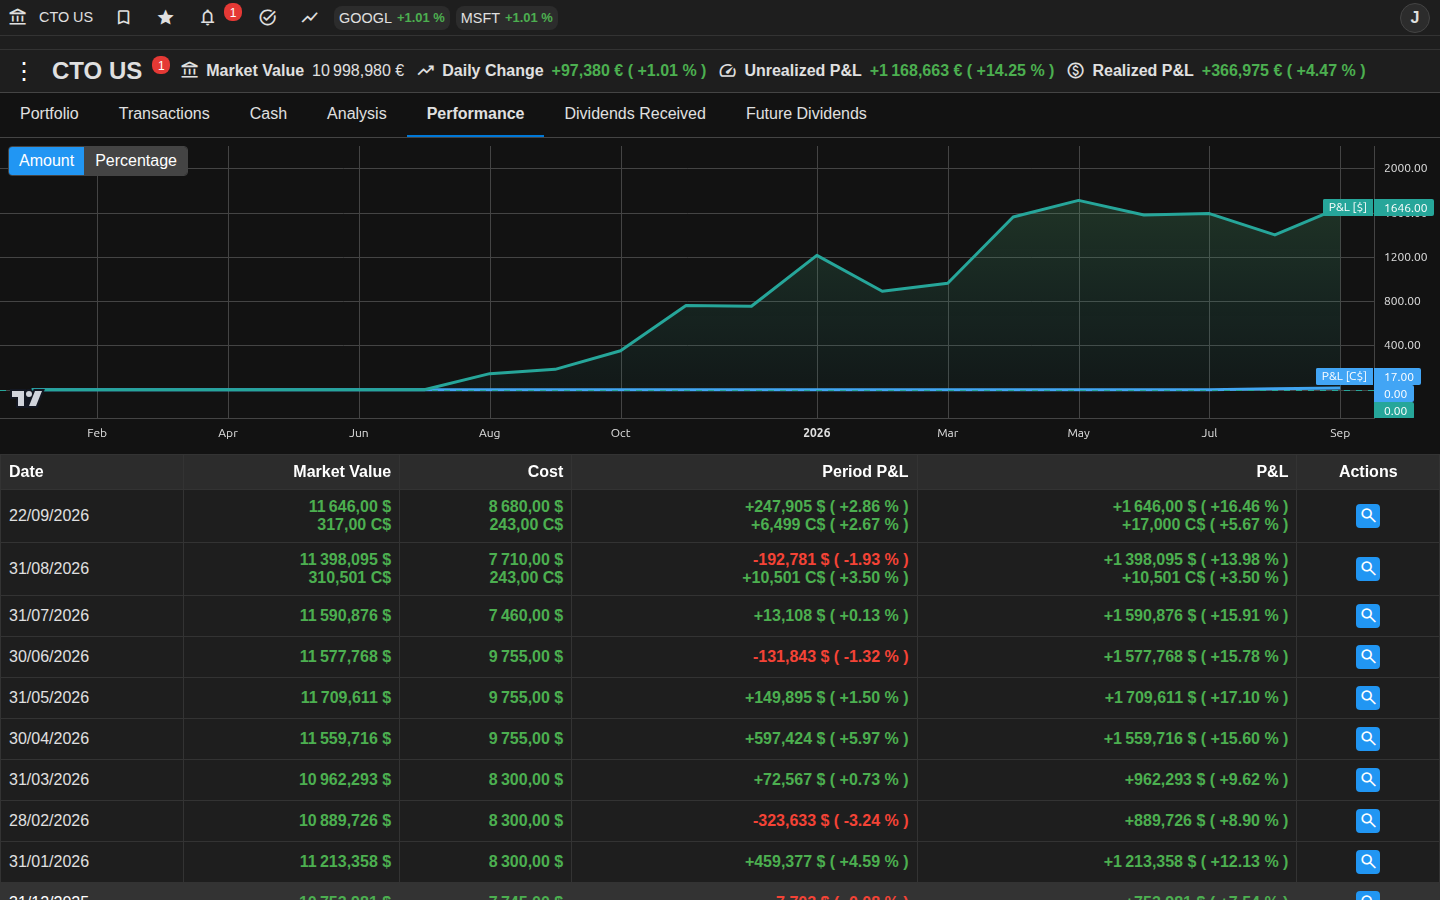
Instant calculation of unrealized and realized P&L, including fees and reinvested dividends.
Measure the real effectiveness of your capital compared to market indices.
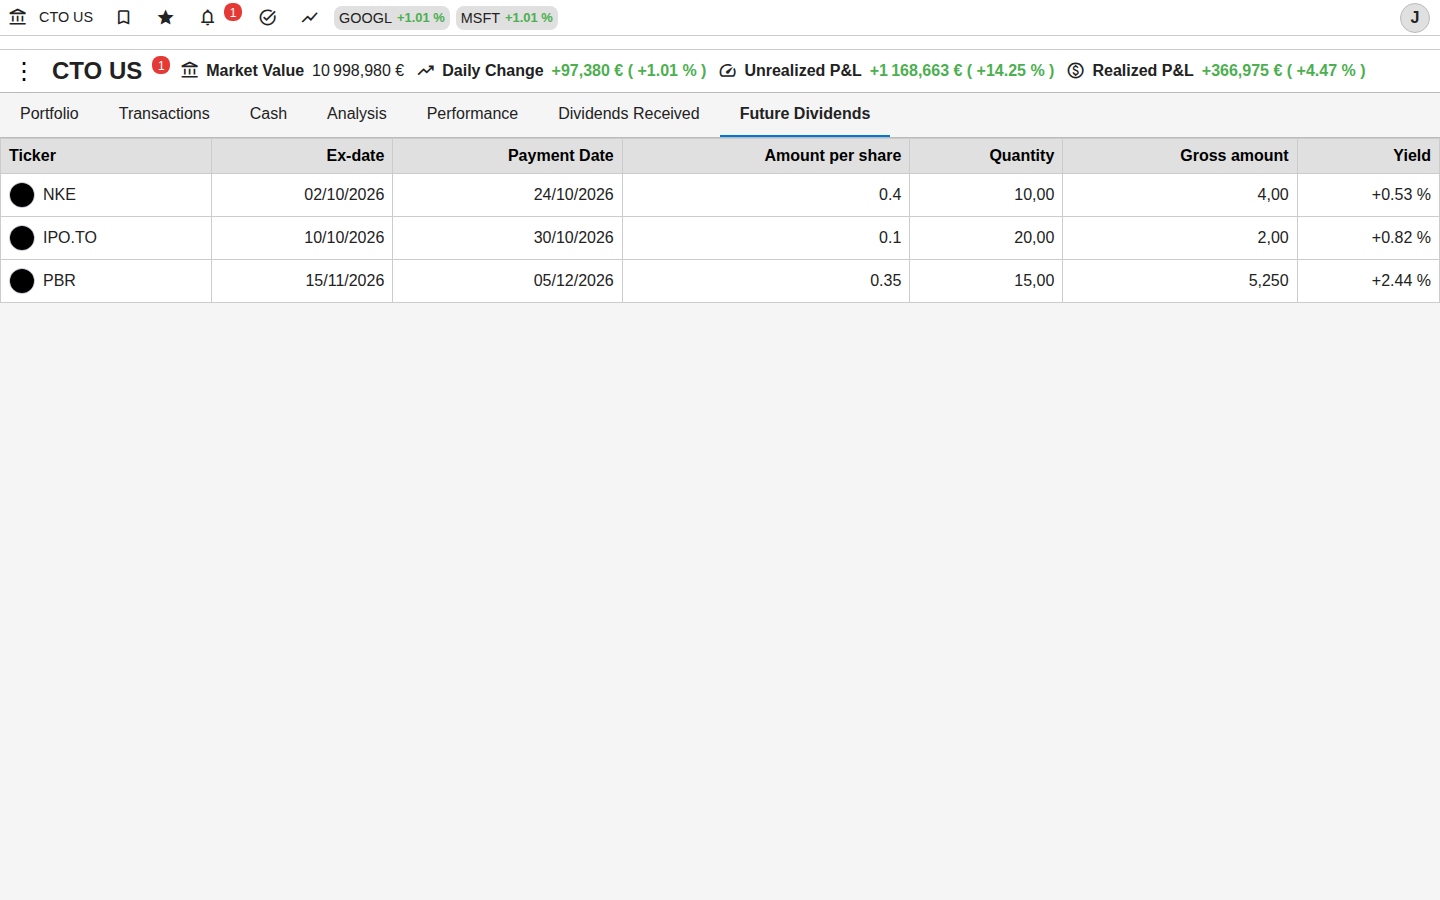
Anticipate the Future (Dividends & Earnings)
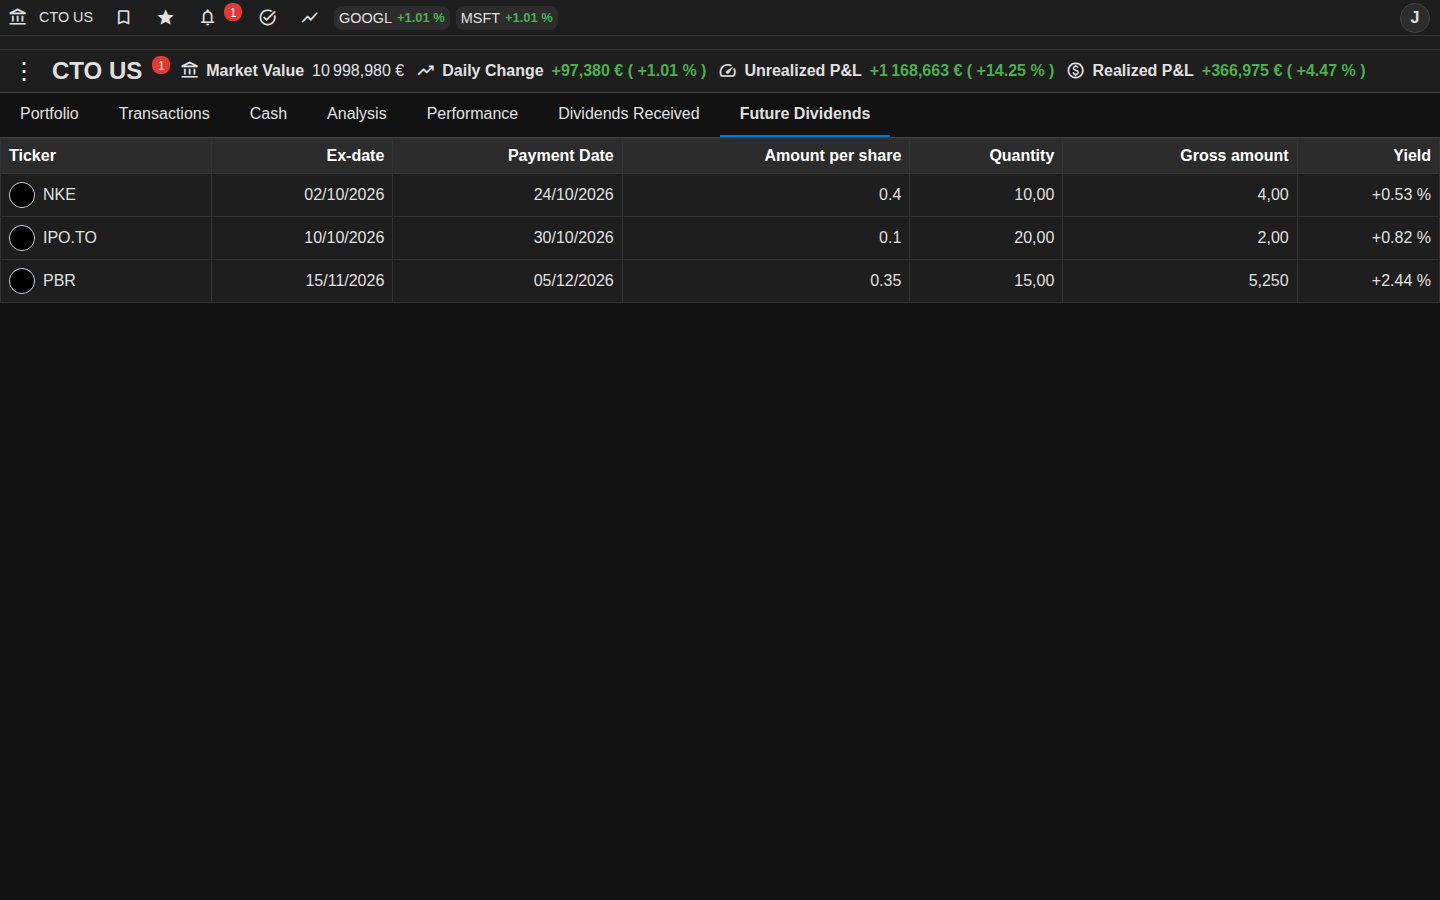
Visualize upcoming dividends and next earnings release dates directly on your positions.
Plan your passive income and stay informed of key events without research effort.
Stock Split Management
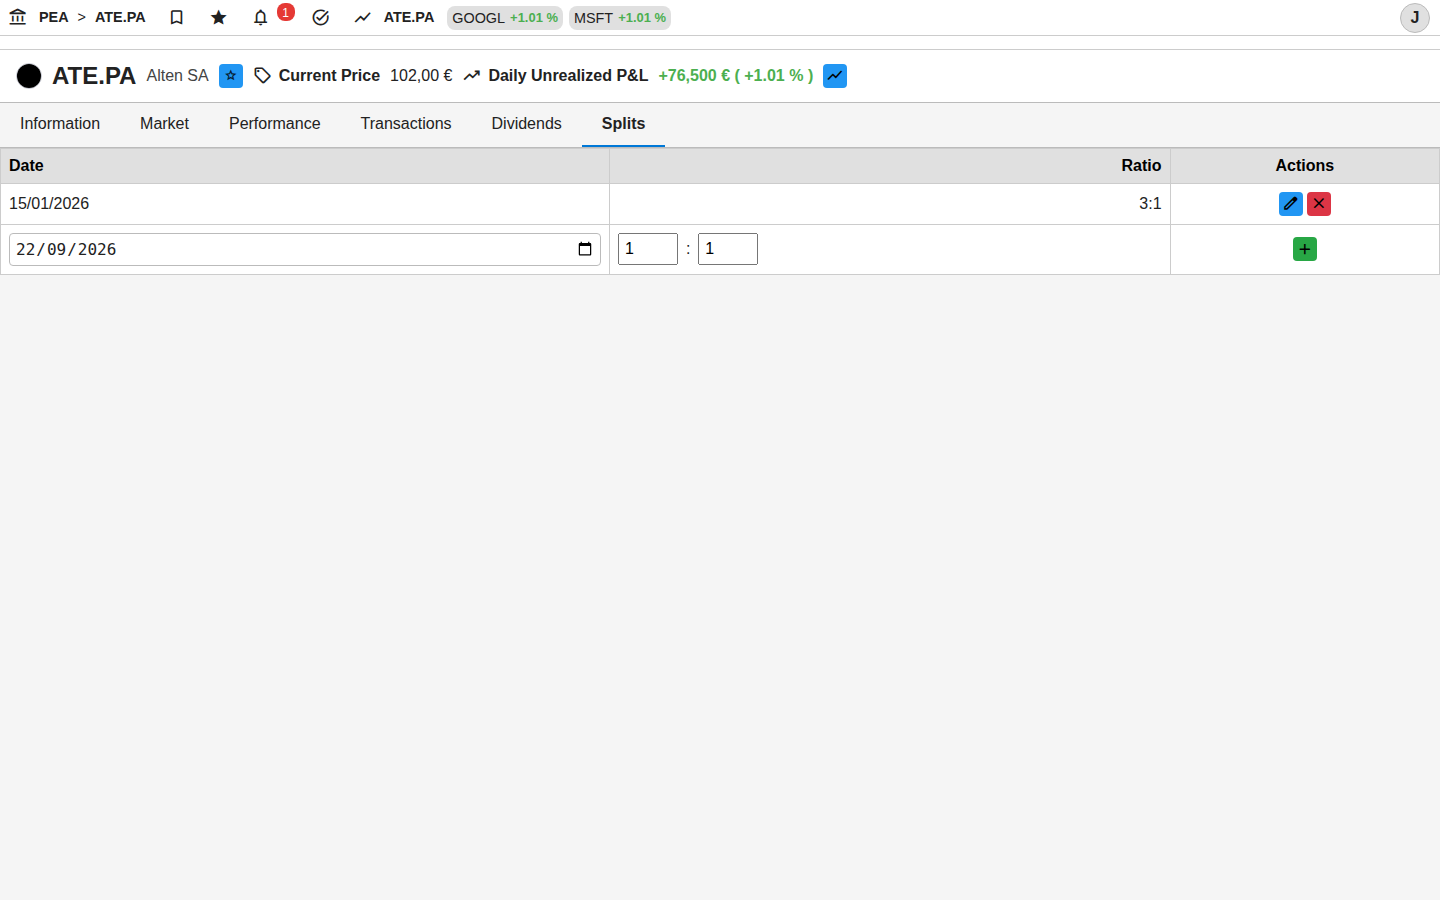
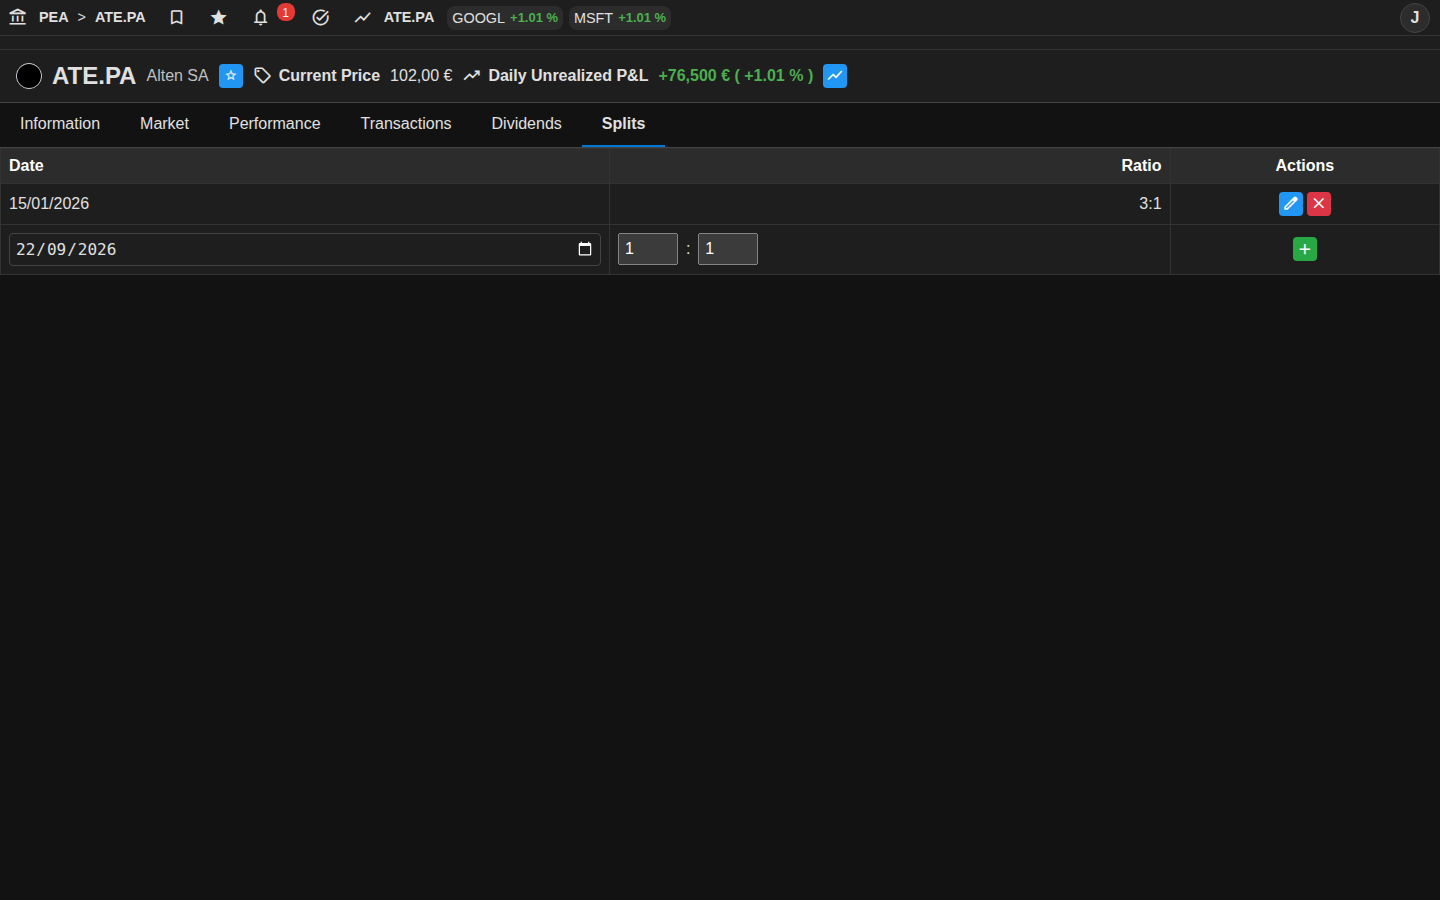
Automatic support for stock splits to maintain the accuracy of your cost basis and historical performance.
Your calculations remain accurate even after a split, without any manual intervention on your past transactions.
Integrated Alerts
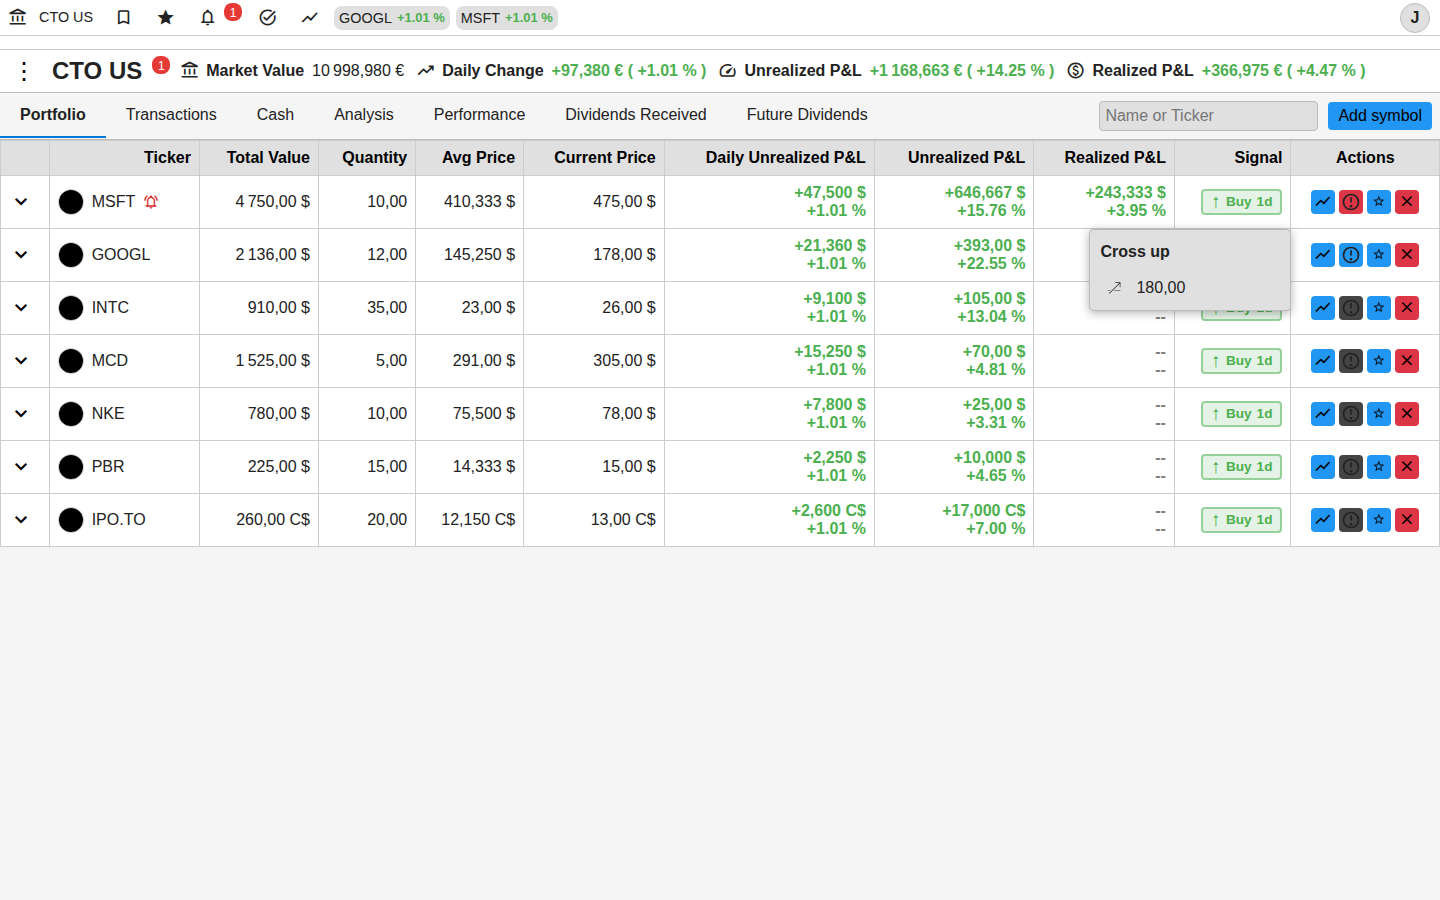
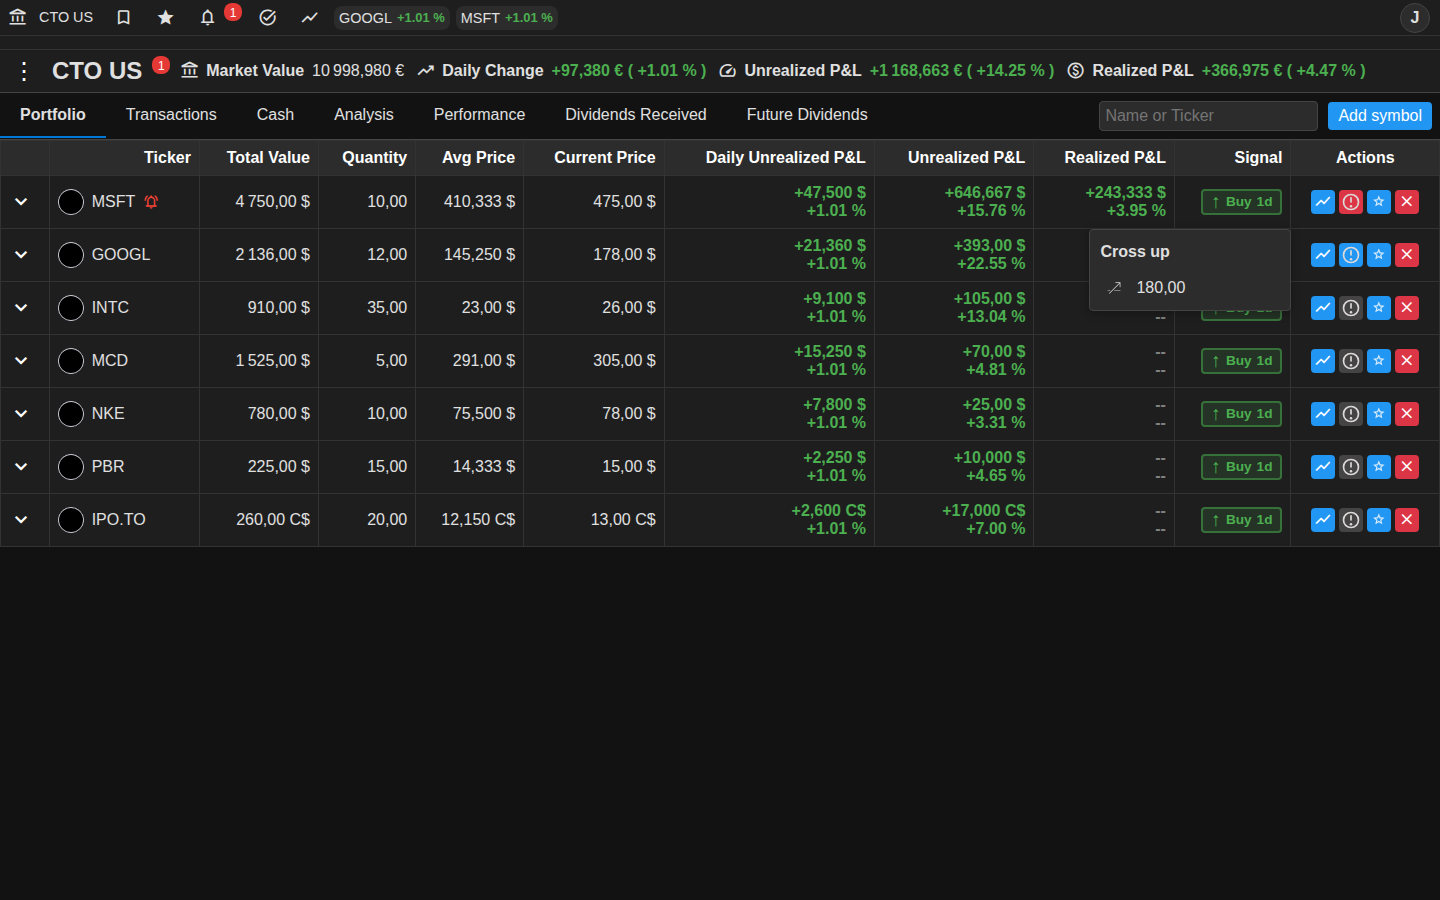
Keep an eye on your price targets and alert thresholds without leaving your dashboard.
Maximum responsiveness: be visually alerted as soon as one of your positions reaches a key level.
Unlimited Multi-Portfolios
Create as many portfolios as needed (Brokerage, IRA, Crypto) to isolate your strategies.
Manage your long-term pocket, tests, and watchlists separately.
Smart Consolidated View
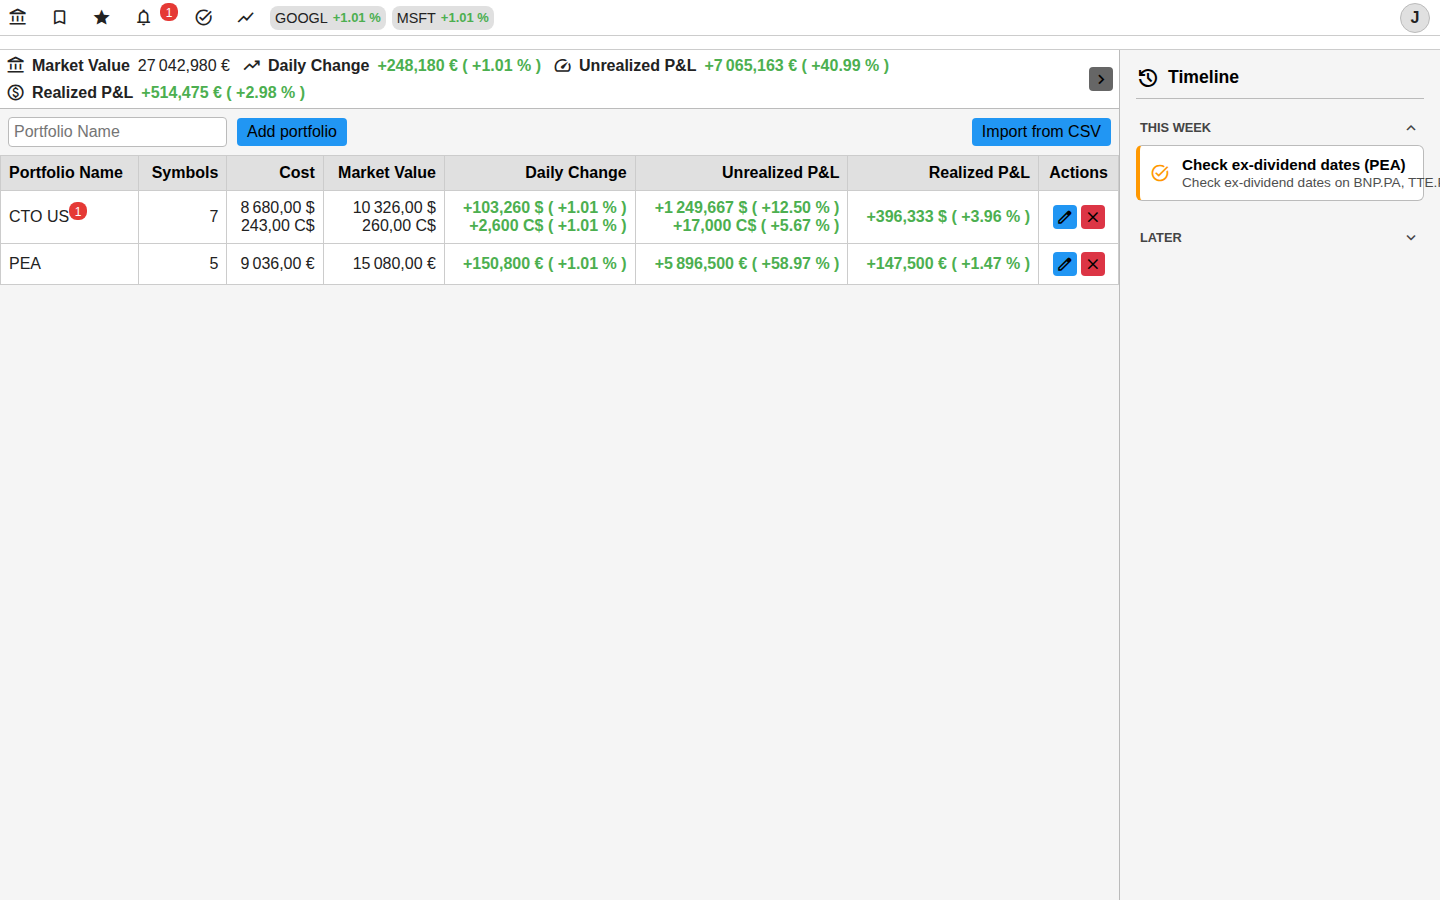
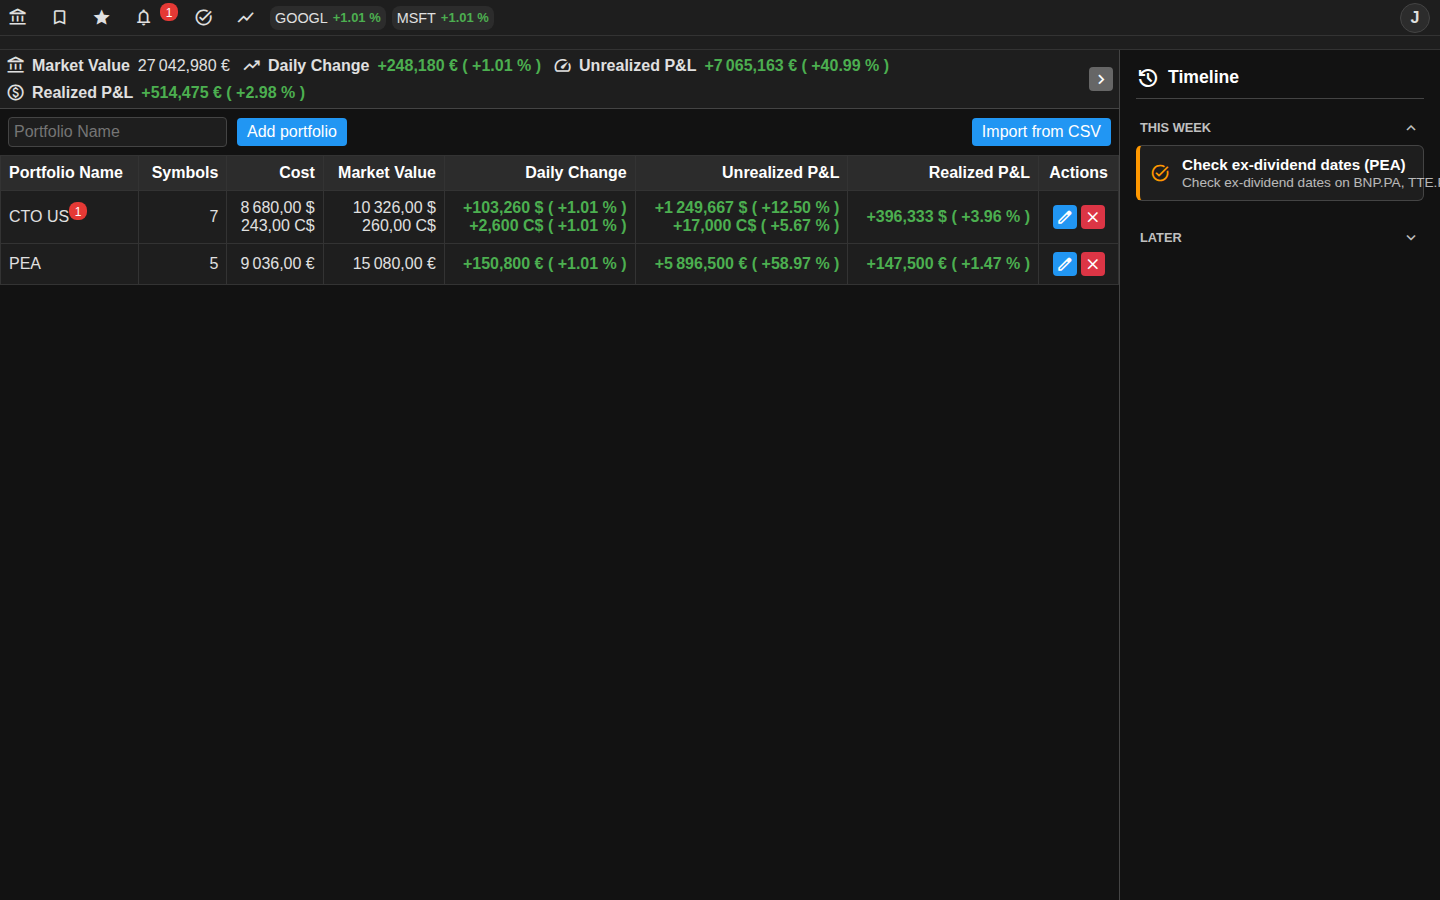
Dashboard grouping data from all your portfolios for global analysis.
Immediately identify sector or geographic overexposures across all your accounts.